When working with GreenFeed system you must:
- Retrieve data from each GreenFeed unit
- Check animal visitation
- Filtering and process data for further analysis
The greenfeedr makes these steps fast and easy:
- It provides functions for downloading, reporting, and processing GreenFeed data
This document introduces you to greenfeedr’s set of tools, and shows you how to apply them to data frames.
# install.packages("greenfeedr")
library(greenfeedr)
#> Thank you for using the greenfeedr package!
#> Cite: Martinez-Boggio et al. (2024). Greenfeedr: an R-package for processing and reporting GreenFeed data.
#> Type 'help(greenfeedr)' for summary information
Download data with get_gfdata()
The first step in working with GreenFeed is to retrieve your data from the system. This can be done manually by logging into the GreenFeed web interface C-Lock Inc. using your username and password.
However, there is a simpler approach: that is via the API using
get_gfdata() function. This function automates the data
retrieval process, allowing you to specify user and password, units, and
date range to download the data directly from C-Lock Inc. server.
Note that if you have multiple studies simultaneously, you can define a list of studies as follows:
USER <- "your_username"
PASS <- "your_password"

studies <- list(
  list(
    Experiment = "Experiment_01",
    Unit = c(2, 3),
    StartDate = "2024-01-20",
    EndDate = Sys.Date(),
    save_dir = "/tempdir()/Experiment_01/"
  ),
  list(
    Experiment = "Experiment_02",
    Unit = c(212),
    StartDate = "2024-02-01",
    EndDate = Sys.Date(),
    save_dir = "/tempdir()/Experiment_02/"
  )
)

# Here you loop (using 'for') over all your studies applying get_gfdata() function
# for (element in studies) {
#  get_gfdata(USER, PASS, element$Experiment, element$Unit, element$StartDate, element$EndDate, element$save_dir)
# }
How it looks the GreenFeed data?
The package provides daily and final datasets for you to explore the basic format of GreenFeed data. The data provided is actual data from a 32-cow study.
# Open the daily data downloaded from C-Lock Inc. server
daily_data <- readr::read_csv(system.file("extdata", "StudyName_GFdata.csv", package = "greenfeedr"), show_col_types = FALSE)

# View the structure of the daily data
str(daily_data)
#> spc_tbl_ [256 × 21] (S3: spec_tbl_df/tbl_df/tbl/data.frame)
#>  $ FeederID              : num [1:256] 1 1 1 1 1 1 1 1 1 1 ...
#>  $ AnimalName            : chr [1:256] "\"000000000840003250681664\"" "\"000000000840003250681664\"" "\"000000000840003250681799\"" "\"000000000840003250681664\"" ...
#>  $ RFID                  : chr [1:256] "000000000840003250681664" "000000000840003250681664" "000000000840003250681799" "000000000840003250681664" ...
#>  $ StartTime             : chr [1:256] "5/13/24 9:33" "5/13/24 10:25" "5/13/24 12:29" "5/13/24 13:06" ...
#>  $ EndTime               : chr [1:256] "5/13/24 9:36" "5/13/24 10:32" "5/13/24 12:45" "5/13/24 13:12" ...
#>  $ GoodDataDuration      : 'hms' num [1:256] 00:02:31 00:06:09 00:10:21 00:04:00 ...
#>   ..- attr(*, "units")= chr "secs"
#>  $ CO2GramsPerDay        : num [1:256] 10531 14032 9242 14735 20080 ...
#>  $ CH4GramsPerDay        : num [1:256] 466 577 301 498 756 ...
#>  $ O2GramsPerDay         : num [1:256] 6815 8799 6173 10636 11021 ...
#>  $ H2GramsPerDay         : num [1:256] 0 0 0 0 0 0 0 0 0 0 ...
#>  $ H2SGramsPerDay        : num [1:256] 0 0 0 0 0 0 0 0 0 0 ...
#>  $ AirflowLitersPerSec   : num [1:256] 34 34 33.9 33.8 33.7 ...
#>  $ AirflowCf             : num [1:256] 1.07 1.07 1.07 1.07 1.07 ...
#>  $ WindSpeedMetersPerSec : num [1:256] 0.0185 0.0686 0.0682 0.1345 0.1094 ...
#>  $ WindDirDeg            : num [1:256] 27.3 314.5 58 42.1 35.4 ...
#>  $ WindCf                : num [1:256] 1 1.01 1.01 1.03 1.02 ...
#>  $ WasInterrupted        : logi [1:256] NA NA NA NA NA NA ...
#>  $ InterruptingTags      : chr [1:256] "\"\"" "\"\"" "\"\"" "\"\"" ...
#>  $ TempPipeDegreesCelsius: num [1:256] 17.2 19 21.9 22.3 22.6 ...
#>  $ IsPreliminary         : num [1:256] 1 1 1 1 1 1 1 1 1 1 ...
#>  $ RunTime               : chr [1:256] "6/27/24 0:54" "6/27/24 0:54" "6/27/24 0:54" "6/27/24 0:54" ...
#>  - attr(*, "spec")=
#>   .. cols(
#>   ..   FeederID = col_double(),
#>   ..   AnimalName = col_character(),
#>   ..   RFID = col_character(),
#>   ..   StartTime = col_character(),
#>   ..   EndTime = col_character(),
#>   ..   GoodDataDuration = col_time(format = ""),
#>   ..   CO2GramsPerDay = col_double(),
#>   ..   CH4GramsPerDay = col_double(),
#>   ..   O2GramsPerDay = col_double(),
#>   ..   H2GramsPerDay = col_double(),
#>   ..   H2SGramsPerDay = col_double(),
#>   ..   AirflowLitersPerSec = col_double(),
#>   ..   AirflowCf = col_double(),
#>   ..   WindSpeedMetersPerSec = col_double(),
#>   ..   WindDirDeg = col_double(),
#>   ..   WindCf = col_double(),
#>   ..   WasInterrupted = col_logical(),
#>   ..   InterruptingTags = col_character(),
#>   ..   TempPipeDegreesCelsius = col_double(),
#>   ..   IsPreliminary = col_double(),
#>   ..   RunTime = col_character()
#>   .. )
#>  - attr(*, "problems")=<externalptr>

# View the first few rows of the daily data
head(daily_data)
#> # A tibble: 6 × 21
#>   FeederID AnimalName    RFID  StartTime EndTime GoodDataDuration CO2GramsPerDay
#>      <dbl> <chr>         <chr> <chr>     <chr>   <time>                    <dbl>
#> 1        1 "\"000000000… 0000… 5/13/24 … 5/13/2… 02'31"                   10531.
#> 2        1 "\"000000000… 0000… 5/13/24 … 5/13/2… 06'09"                   14032.
#> 3        1 "\"000000000… 0000… 5/13/24 … 5/13/2… 10'21"                    9242.
#> 4        1 "\"000000000… 0000… 5/13/24 … 5/13/2… 04'00"                   14735.
#> 5        1 "\"000000000… 0000… 5/13/24 … 5/13/2… 04'55"                   20080.
#> 6        1 "\"000000000… 0000… 5/13/24 … 5/13/2… 03'42"                   13905.
#> # ℹ 14 more variables: CH4GramsPerDay <dbl>, O2GramsPerDay <dbl>,
#> #   H2GramsPerDay <dbl>, H2SGramsPerDay <dbl>, AirflowLitersPerSec <dbl>,
#> #   AirflowCf <dbl>, WindSpeedMetersPerSec <dbl>, WindDirDeg <dbl>,
#> #   WindCf <dbl>, WasInterrupted <lgl>, InterruptingTags <chr>,
#> #   TempPipeDegreesCelsius <dbl>, IsPreliminary <dbl>, RunTime <chr>

# Open the finalized data received from C-Lock Inc.
final_data <- readxl::read_excel(system.file("extdata", "StudyName_FinalReport.xlsx", package = "greenfeedr"),
  col_types = c("text", "text", "numeric", rep("date", 3), rep("numeric", 12), "text", rep("numeric", 6))
)

# View the structure of the daily data
str(final_data)
#> tibble [467 × 25] (S3: tbl_df/tbl/data.frame)
#>  $ RFID                              : chr [1:467] "840003250681664" "840003250681664" "840003250681799" "840003250681664" ...
#>  $ Farm Name                         : chr [1:467] "840003250681664" "840003250681664" "840003250681799" "840003250681664" ...
#>  $ FID                               : num [1:467] 1 1 1 1 1 1 1 1 1 1 ...
#>  $ Start Time                        : POSIXct[1:467], format: "2024-05-13 09:33:24" "2024-05-13 10:25:44" ...
#>  $ End Time                          : POSIXct[1:467], format: "2024-05-13 09:36:31" "2024-05-13 10:32:40" ...
#>  $ Good Data Duration                : POSIXct[1:467], format: "1899-12-31 00:02:31" "1899-12-31 00:06:09" ...
#>  $ Hour Of Day                       : num [1:467] 9.56 10.43 12.48 13.11 14.58 ...
#>  $ CO2 Massflow (g/d)                : num [1:467] 10541 14080 9273 14831 20187 ...
#>  $ CH4 Massflow (g/d)                : num [1:467] 467 579 302 501 760 ...
#>  $ O2 Massflow (g/d)                 : num [1:467] 6822 8829 6194 10705 11080 ...
#>  $ H2 Massflow (g/d)                 : num [1:467] 0 0 0 0 0 0 0 0 0 0 ...
#>  $ H2S Massflow (g/d)                : num [1:467] 0 0 0 0 0 0 0 0 0 0 ...
#>  $ Average Airflow (L/s)             : num [1:467] 34 34 33.9 33.8 33.7 ...
#>  $ Airflow CF                        : num [1:467] 1.07 1.07 1.07 1.07 1.07 ...
#>  $ Average Wind Speed (m/s)          : num [1:467] 0.0185 0.0686 0.0682 0.1345 0.1094 ...
#>  $ Average Wind Direction (deg)      : num [1:467] 27.3 314.5 58 42.1 35.4 ...
#>  $ Wind CF                           : num [1:467] 1 1.02 1.02 1.03 1.03 ...
#>  $ Was Interrupted                   : num [1:467] NA NA NA NA NA NA NA NA NA NA ...
#>  $ Interrupting Tags                 : chr [1:467] "''" "''" "''" "''" ...
#>  $ Midpoint Since Last               : num [1:467] NA NA NA NA NA NA NA NA NA NA ...
#>  $ Midpoint Until Next               : num [1:467] NA NA NA NA NA NA NA NA NA NA ...
#>  $ Standard Deviation of CH4 Baseline: num [1:467] 6.66 6.57 6.17 5.16 3.06 ...
#>  $ Pipe Temperature (deg C)          : num [1:467] 17.2 19 21.9 22.3 22.6 ...
#>  $ Gas Temperature (deg C)           : num [1:467] 25 25.2 27.2 27.7 28.8 ...
#>  $ RID                               : num [1:467] 609715 609715 609715 609715 609715 ...

# View the first few rows of the daily data
head(final_data)
#> # A tibble: 6 × 25
#>   RFID            `Farm Name`       FID `Start Time`        `End Time`
#>   <chr>           <chr>           <dbl> <dttm>              <dttm>
#> 1 840003250681664 840003250681664     1 2024-05-13 09:33:24 2024-05-13 09:36:31
#> 2 840003250681664 840003250681664     1 2024-05-13 10:25:44 2024-05-13 10:32:40
#> 3 840003250681799 840003250681799     1 2024-05-13 12:29:02 2024-05-13 12:45:19
#> 4 840003250681664 840003250681664     1 2024-05-13 13:06:20 2024-05-13 13:12:14
#> 5 840003250681664 840003250681664     1 2024-05-13 14:34:58 2024-05-13 14:41:52
#> 6 840003234513955 840003234513955     1 2024-05-13 14:59:14 2024-05-13 15:11:50
#> # ℹ 20 more variables: `Good Data Duration` <dttm>, `Hour Of Day` <dbl>,
#> #   `CO2 Massflow (g/d)` <dbl>, `CH4 Massflow (g/d)` <dbl>,
#> #   `O2 Massflow (g/d)` <dbl>, `H2 Massflow (g/d)` <dbl>,
#> #   `H2S Massflow (g/d)` <dbl>, `Average Airflow (L/s)` <dbl>,
#> #   `Airflow CF` <dbl>, `Average Wind Speed (m/s)` <dbl>,
#> #   `Average Wind Direction (deg)` <dbl>, `Wind CF` <dbl>,
#> #   `Was Interrupted` <dbl>, `Interrupting Tags` <chr>, …
Report data with report_gfdata()
The next step in working with GreenFeed is to check animal visitation
and gases production on animals and on a daily basis. The
report_gfdata() function allows you to download the daily
data and generates an easy-to-read report to check your GreenFeed on the
farm. In addition, you can use report_gfdata() to generate
a final report of your study by providing the final data received from
C-Lock Inc. three to four weeks after the end of your study.
This function is very useful when you have several studies and units running simultaneously to check that the study is going in the right direction.
Process data with process_gfdata()
It is finally time to process your GreenFeed data for analysis. The most frequently asked questions are:
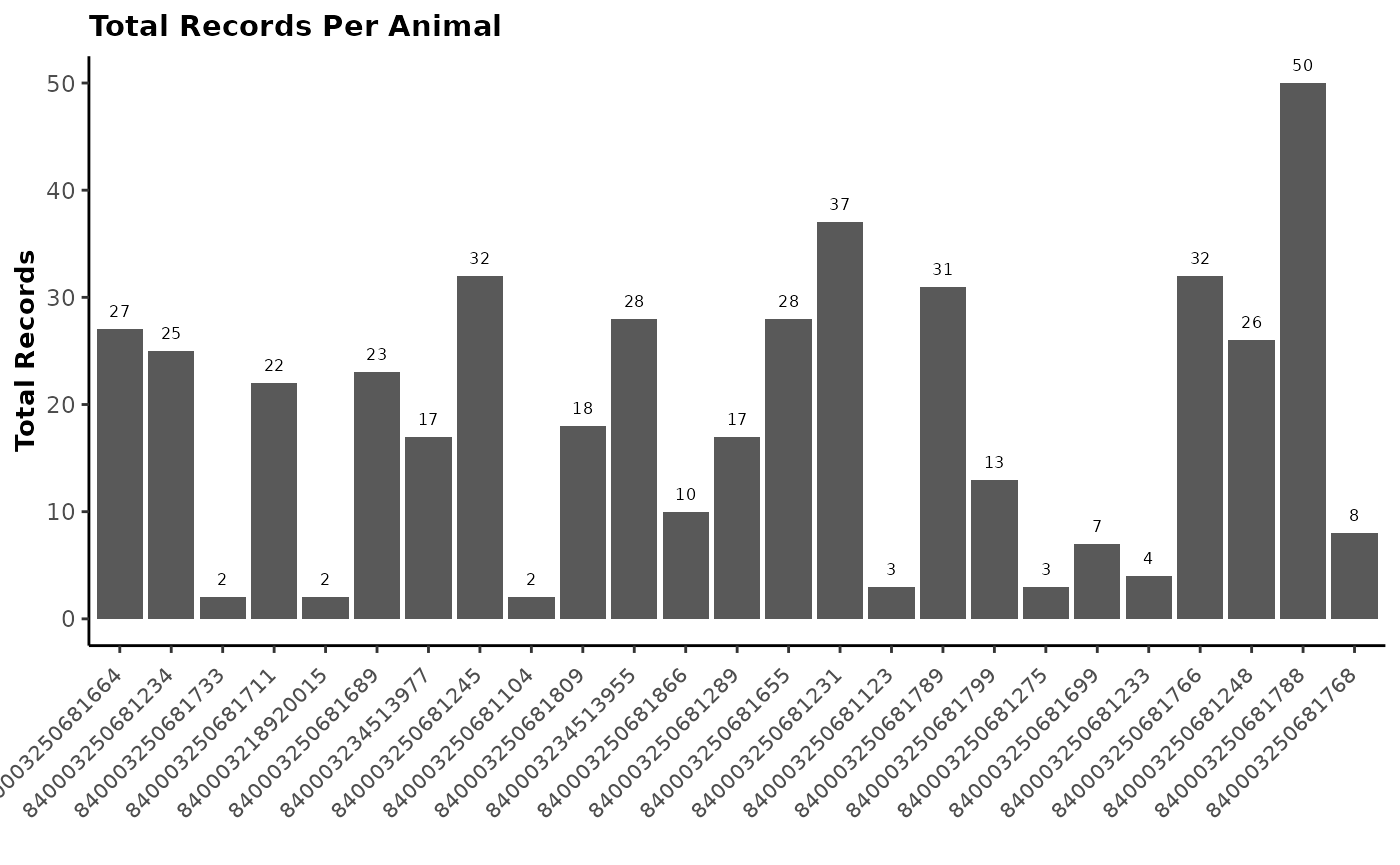
- What is the minimum acceptable time that my records should last?
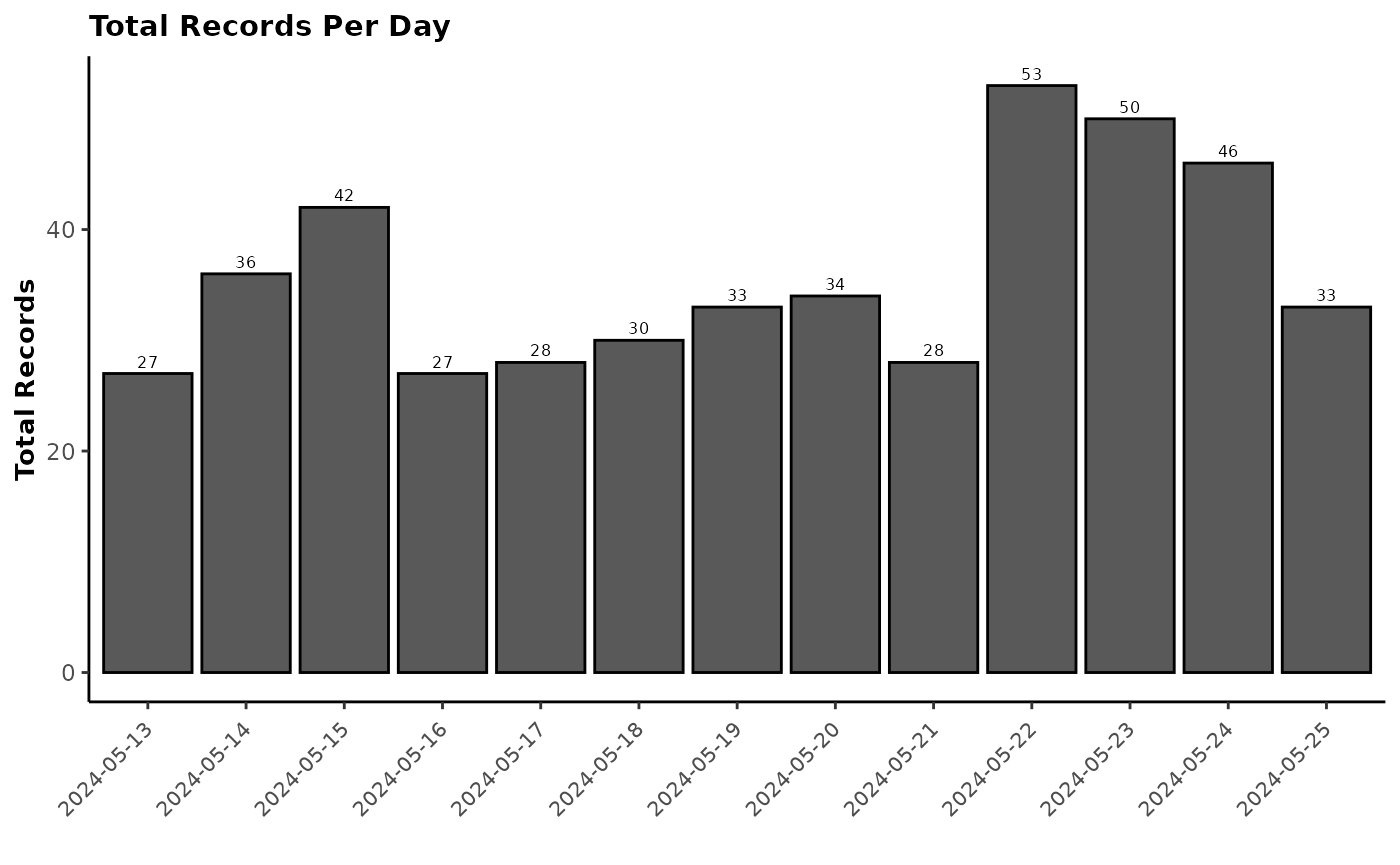
- How many records should I have per day?
- How many days with records should I keep per week?
However, since there is no single answer, these values will depend on many factors such as the duration of the study, number of animals, feeding, time of year, etc.
The process_gfdata() function allows you to explore your
data and use different sets of parameters (param1, param2, and min_time)
and check how many records and animals you keep for analysis. To do that
you can follow the example in the README
file
Process pellet intakes and visits with pellin() and
viseat()
The greenfeedr includes additional functions to help you process daily entries and visits. To check animal visits, you must access the GreenFeed web interface and, in the data tab, select “Download Large Dataset” and define the time period for which you want to analyze data. In the folder that the system downloads to your computer, you will find a file ‘feedtimes’.
This is the file you will use as input for pellin and viseat. If you have more than one ‘feedtimes’ file because you are using multiple GreenFeed units in the same experiment then you just need to include them as a list of files.
Note that you should include the result obtained from the 10-drops test. If units have different gram values, define ‘gcup’ as a vector with an element for each unit.
file <- list(system.file("extdata", "feedtimes.csv", package = "greenfeedr"))

result <- pellin(
  file_path = file,
  unit = 1,
  gcup = 34,
  start_date = "2024-05-13",
  end_date = "2024-05-25",
  save_dir = tempdir()
)
#> Please set the 'gcup' parameter based on the 10-drops test.
#>            If units have different gram values, define 'gcup' as a vector with an element for each unit.
#> RFID is NULL. It is recommended to include it.
#> Pellet intakes file created and saved to /tmp/Rtmpgi4J3t

head(result)
#> # A tibble: 6 × 3
#>   Date       RFID            PIntake_kg
#>   <date>     <chr>                <dbl>
#> 1 2024-05-13 154150620340444      0
#> 2 2024-05-13 840003218921444      0.034
#> 3 2024-05-13 840003234513777      0.714
#> 4 2024-05-13 840003234513888      0.17
#> 5 2024-05-13 840003250681111      0.068
#> 6 2024-05-13 840003250681222      0.85